Key Highlights
- 0-60.0 Satoshis is turning out to be a major support area for Dogecoin, as forecasted in one of the recent analyses.
- Dogecoin prices are trading higher and currently testing an important resistance area.
- A break above 70.0 Satoshis might set up the path for more gains in the short term.
Dogecoin is setting up nicely for a continuation of the bullish trend, and it looks like the correction phase is over.
Pivot Area – 70.0 Satoshis
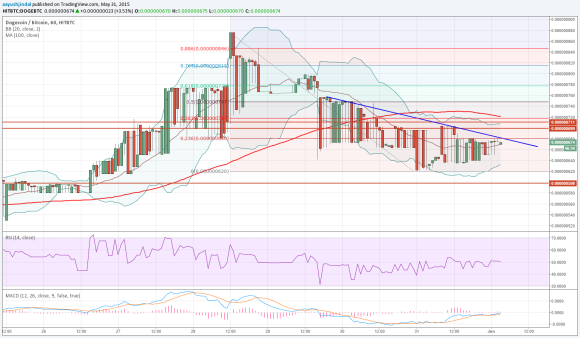
Dogecoin price looks like settled around 62.0 Satoshis, as it has moved higher and forming a bullish breakout pattern on the hourly chart. There is a bearish trend line formed, which is perfectly coinciding with the 23.6% Fib retracement level of the last drop from 87.7 Satoshis to 62.0 Satoshis. A break above the highlighted resistance area might be an initial signal that the price is about to move higher.
However, there is a major resistance formed around 70.0 Satoshis, as it represents a previous swing area where sellers struggled earlier. So, looking ahead there is a chance that buyers face a tough time to break the stated area. One more factor that comes into play is the 100 hourly simple moving average, which is aligned with the 70.0 Satoshis resistance area. Moreover, the Upper Bollinger Band is coinciding with the 100 MA, suggesting that 70.0 – 71.0 Satoshis is a monster hurdle for buyers in the near term.
If sellers fail to defend the stated hurdle, then a retest of the recent swing high of 87.7 is likely moving ahead where buyers might struggle one more time.
Intraday Support Level – 62.0 Satoshis
Intraday Resistance Level – 70.0 Satoshis
If the price fails to break higher, then on the downside an initial support lies at the Lower Bollinger Band. However, the most critical support lies at 62.0.
Charts courtesy of Trading View


