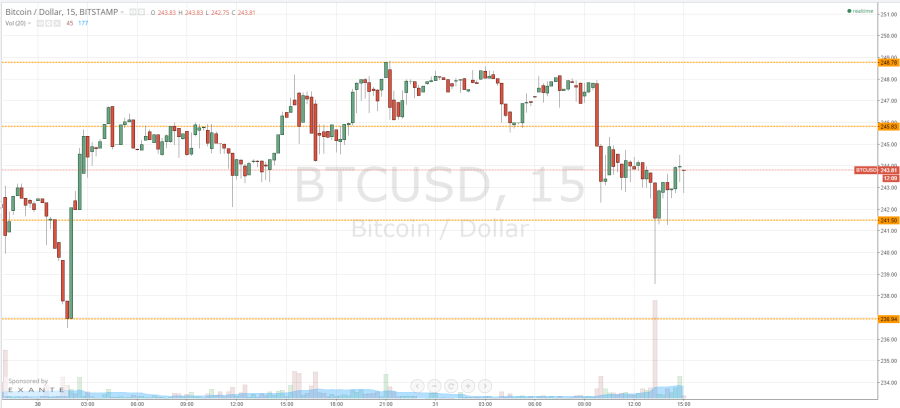
Earlier this morning, in our pre session daily look at the bitcoin price, we highlighted the levels we were keeping an eye on, and suggested that a break of these levels would infer an intraday bias. We also highlighted a couple of key short-term targets for which we would aim in the event of such a break. Action has now matured throughout the European session, and as we head into the US afternoon, what can be inferred from this action and what are we now keeping an eye on? Take a look at the chart.
As you can see, earlier this morning we were trading between in term support at 245.83 and resistance at 248.78. As the European session open for the day, we got a break down through aforementioned support, signalling a bearish bias towards a target of – initially – 240.83. Price reached this target shortly after midday, and continue to decline to intraday lows just shy of 239 flat, before correcting to trade back within what now serves as in term support at 241.50 and resistance at 245.83. These are the levels to watch going forward.
If we get a break of 245.83, it would serve up an intraday bullish bias and validate an initial upside target of 248.78. In such a scenario, a stop loss just below 245.83 would take us out of the trade in the event of a bias reversal.
Conversely, if the bearish overarching momentum continues, and we get a break below 241.50, we will look to 236.94 as our next downside goal. Just as with the long trade aforementioned, a stop loss in the region of 242 would limit our risk on the position.
Charts courtesy of Trading View


