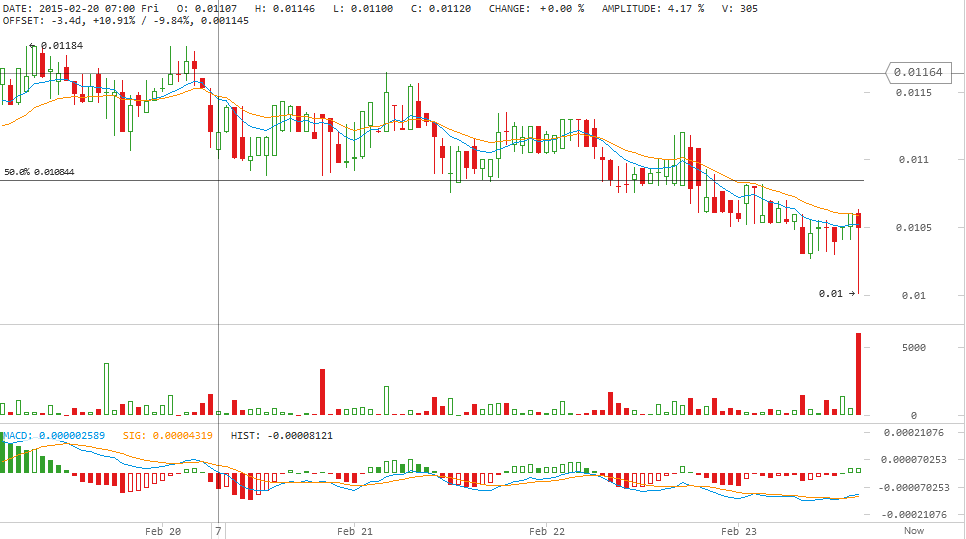
Darkcoin price started to drop yesterday just after bitcoin price started declining, to record a low of 0.01 BTC at the time of writing of this article.
By analyzing the 1 hour Cryptsy (DRK/BTC) chart from bitcoinwisdom.com, plotting the 10 hour EMA (green curve) and the 20 hour EMA (orange curve) and calculating the MACD indicator (look at the below chart), we can conclude the following:
- Today’s trading volume is relatively high as compared to the trading volume throughout the past few days. The big selling volume of the market pulled the price downwards below the 50% Fibonacci retracement level fan at 0.010844 BTC.
- The price has been below the 10 hour and 20 hour EMAs during most of yesterday’s and today’s trading sessions and if it remains so, we can see the price drop down to test the 38.2% Fibonacci retracement fan level at 0.0960 BTC within a couple of days.
- The MACD indicator’s value is in the negative territory, yet the blue MACD indicator line is on top of the red signal line. If the MACD value enters the positive territory soon, we can see the price head north again, especially that a long downwards candlestick shadow is noticeable when the price approached the 0.01 BTC level.
DRK price dropped yesterday as influenced by the bitcoin price drop. It’s not advisable to invest in any long positions now, until it is clear whether or not the 0.01 BTC level will prevent a further drop.
Conclusion:
Darkcoin price dropped yesterday right after bitcoin price started falling. As the price has already breached the 50% Fibonacci retracement fan level at 0.010844 BTC, the following hours will reveal whether or not we can see a further decline.
DRK price dropped yesterday as influenced by the bitcoin price drop. It's not advisable to invest in any long positions now, until it is clear whether or not the 0.01 BTClevel will prevent a further drop.
Charts from Cryptsy


