Key Highlights
- ETH price after declining towards the $6.83 level against US Dollar stated correcting higher.
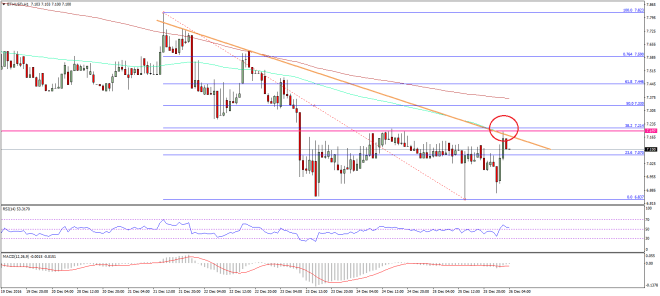
- There is a major resistance area near a bearish trend line on the hourly chart (data feed via SimpleFX) of ETH/USD at $7.20.
- As long as the pair is below the highlighted resistance area, it won’t be easy for the bulls to take the price higher.
Ethereum price formed a weekly low below $7.00 against the US dollar. The ETH/USD pair is currently recovering, but facing resistance near $7.20.
Ethereum Price Upside Barrier
There were further declines in ETH price, as it moved down below the $7.00 handle against the US Dollar. There was a new low formed at $6.83 before the price started a recovery. There was an upside move during which the price moved above the 23.6% Fib retracement level of the last decline from the $7.82 high to $6.83 low. However, the price is currently facing a major resistance area near $7.20.
The stated resistance area is a major pivot. It acted as a barrier for the ETH buyers on many occasions, and may continue to stop the upside move. It also represents the 38.2% Fib retracement level of the last decline from the $7.82 high to $6.83 low. Moreover, there is a bearish trend line on the hourly chart (data feed via SimpleFX) of ETH/USD positioned near the same area.
So, it looks like there is a crucial resistance area on the upside. And, since the price is also below the 100 hourly simple moving average, it won’t be easy for buyers to break it. So, there can be a failure for yet another downside move towards $6.85.
Hourly MACD – The MACD is in the bearish slope, but with less momentum.
Hourly RSI – The RSI just moved above the 50 level, but heading south once again.
Major Support Level – $6.85
Major Resistance Level – $7.20
Charts courtesy – SimpleFX


